Tags: experimentation content
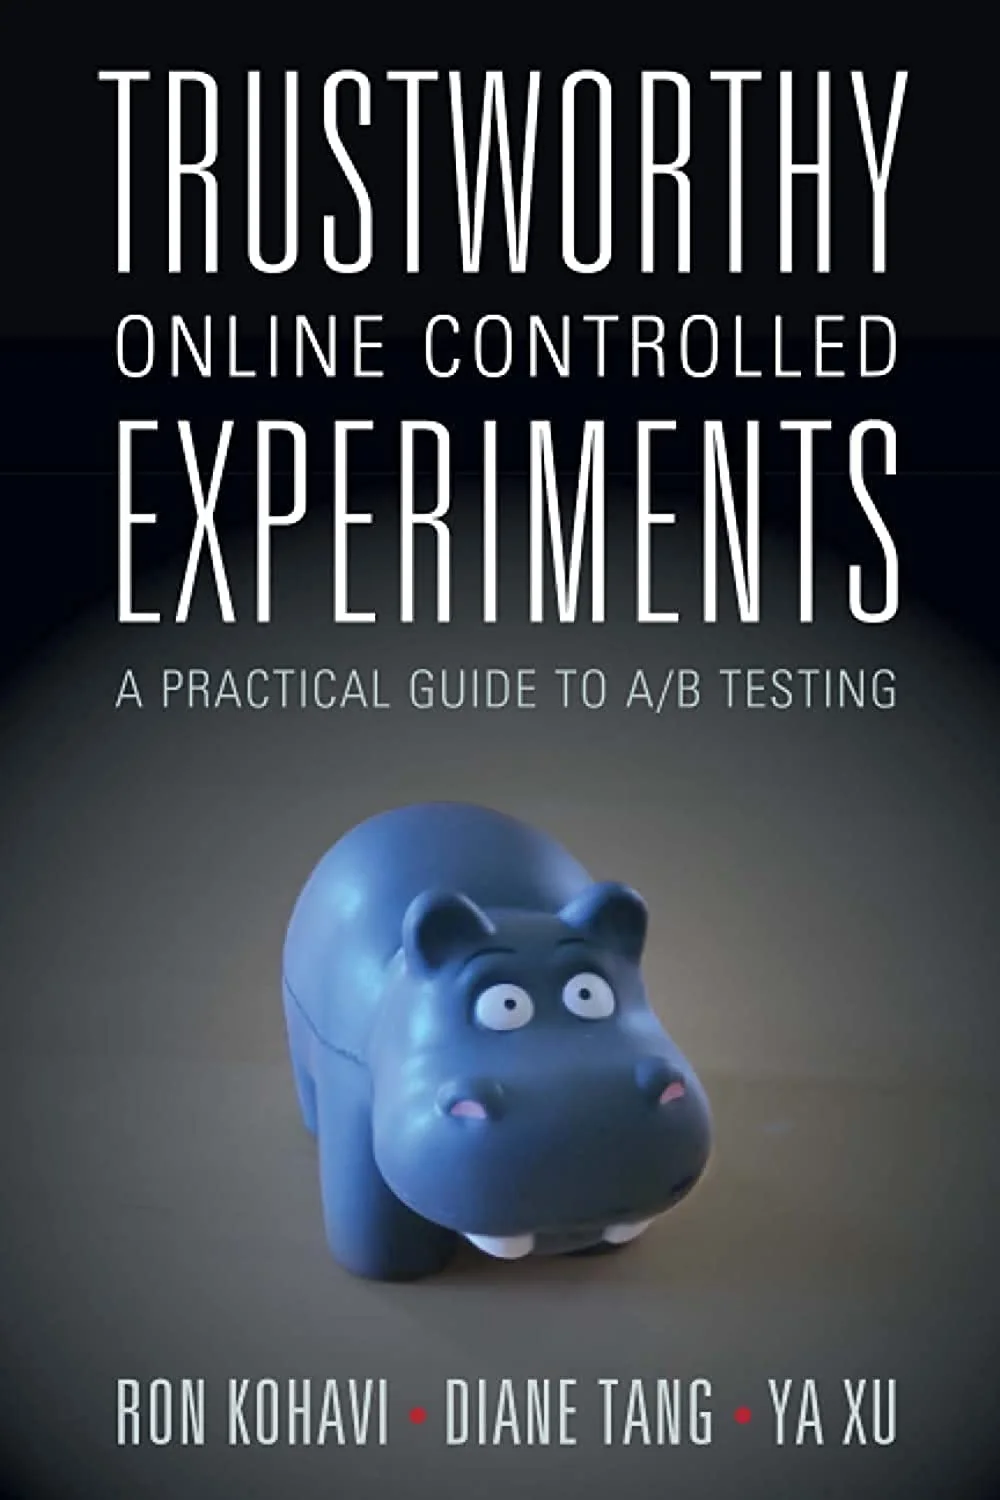
Kohavi - Trustworthy Online Controlled Experiments - 2020
Author: Ron Kohavi, Diane Tang, Ya Xu
Published: 2020, Cambridge University Press
Format: Book, ~250pp
Read:
The field’s standard reference, and the source of most of its vocabulary. Cited constantly, read properly by few — its value is that everyone in experimentation has agreed to treat it as the baseline, so knowing what’s in it is knowing the shared language.
Why it’s the one that gets named
Experimentation had no canonical text before it. The knowledge lived in conference papers, company engineering blogs and individual practitioners’ heads. This book collected it and gave it a shared vocabulary, which is why it’s the default citation and why “have you read Kohavi” functions as a shibboleth.
Referred to as “the Kohavi book” or just “Kohavi”, despite three authors.
Who wrote it, and why that matters
Worth knowing, because the authors’ positions are the book’s authority:
Ron Kohavi     built and led Microsoft's
               experimentation platform (ExP)
               later Airbnb, Amazon

Diane Tang     Google Fellow, Google's
               experiment infrastructure

Ya Xu          led data science at LinkedIn
Three of the largest experimentation platforms in the world, written up together. That’s the claim to authority, and it’s a fair one — but it’s also the source of the book’s main weakness, below.
The organising idea
Trustworthiness, not statistics. The title is the argument: the hard part isn’t running a test, it’s knowing whether to believe the result.
The book’s implicit thesis is that most experiment results are wrong for boring, mechanical reasons, and that a mature programme spends most of its effort on validity rather than on analysis.
What those reasons look like in practice:
instrumentation  the event didn't fire for
                 some users, browsers or
                 devices — the metric is
                 measuring coverage, not effect

assignment       users landed in the wrong arm,
                 or moved between arms across
                 visits or devices

sample ratio     the split isn't the split you
                 asked for, which means
                 something upstream is
                 filtering one arm

dilution         users who could never have
                 seen the change are sitting
                 in the analysis

peeking          the result was read early and
                 often, so the stated error
                 rate is not the real one
Every one of these produces a plausible-looking number. That’s the point — none of them announce themselves, and collectively they are more likely than the result being a genuine effect of the size you were hoping for.
That framing is its real contribution, more than any individual technique.
What it put into circulation
These are the terms people use because of this book:
| Term | What it means |
|---|---|
| OEC — Overall Evaluation Criterion | One metric a test optimises, causally linked to a long-term objective and measurable short-term — Overall Evaluation Criterion |
| Twyman’s law | ”Any figure that looks interesting or different is usually wrong” |
| SRM — Sample Ratio Mismatch | Arms not splitting as designed; the single highest-value automated check — Sample Ratio Mismatch |
| Guardrail metrics | Things that must not get worse — Guardrail Metrics |
| Triggering and dilution | Analyse only users who could have been affected, or the effect is diluted by everyone who never saw it |
| Crawl · walk · run · fly | The experimentation maturity model |
| Institutional memory | The accumulated record of what was tried — Experiment Archive |
Twyman’s law is not theirs. It comes from W. A. Twyman, a UK audience-measurement researcher, and he apparently never wrote it down. Kohavi popularised it in this context — a useful thing to get right, since crediting it to Kohavi is a common slip.
The three worth being able to explain
Naming these is table stakes. Explaining them is the thing that separates having read the book from having heard of it.
OEC — why one metric
The argument: a team optimising several metrics optimises none, because every ambiguous result becomes a negotiation about which metric mattered. An OEC forces that trade-off to be settled before the result is known, which is the only time it can be settled honestly.
Two conditions, and both are hard:
- Measurable within a test’s duration — a metric that takes a year to move can’t referee a two-week test
- Causally linked to the long-term objective — moving it must actually cause the thing you care about, not merely correlate
The failure it exists to prevent is optimising a proxy that diverges from the goal. Clicks are measurable in days and can be increased by making search results worse — so a team optimising clicks can degrade the product while reporting success every quarter — Overall Evaluation Criterion, Metric Design.
Triggering and dilution
The most practically useful technique in the book, and the least known outside it.
If a change can only affect some users, including everyone else drags the measured effect towards zero:
change affects only users who reach
the delivery step — say 20% of visitors

MEASURED ON EVERYONE
  true effect 5% on those who saw it
  5% × 20%  =  1% observed
  → underpowered, reads as flat

MEASURED ON TRIGGERED USERS ONLY
  → 5% observed
  → the effect is actually visible
Analyse only the users who could have been affected. The catch is instrumentation: you must log the trigger point in both arms — recording who would have seen the change in the control group, where by definition nothing happened. That’s a decision made before the test runs and cannot be reconstructed afterwards, which is why it’s so often missed — Experiment Assignment Tracking.
Crawl, walk, run, fly
The maturity model, referenced constantly and rarely explained:
CRAWL   a handful of tests a quarter
        analysis is manual
        the platform itself is unproven

WALK    tests are routine
        metrics standardised
        SRM and guardrail checks automatic

RUN     experimentation is the default way
        changes ship; dozens run at once
        the org expects tests, not opinions

FLY     nearly every change is an experiment,
        infrastructure included
        results feed institutional memory
Its actual purpose is to stop teams comparing themselves to Microsoft. The common failure is a programme at crawl adopting fly-stage practices — sophisticated variance reduction on twelve tests a quarter — instead of fixing the instrumentation that makes those twelve untrustworthy.
The stories everyone cites
The Bing ad headline experiment. The canonical anecdote of the whole field.
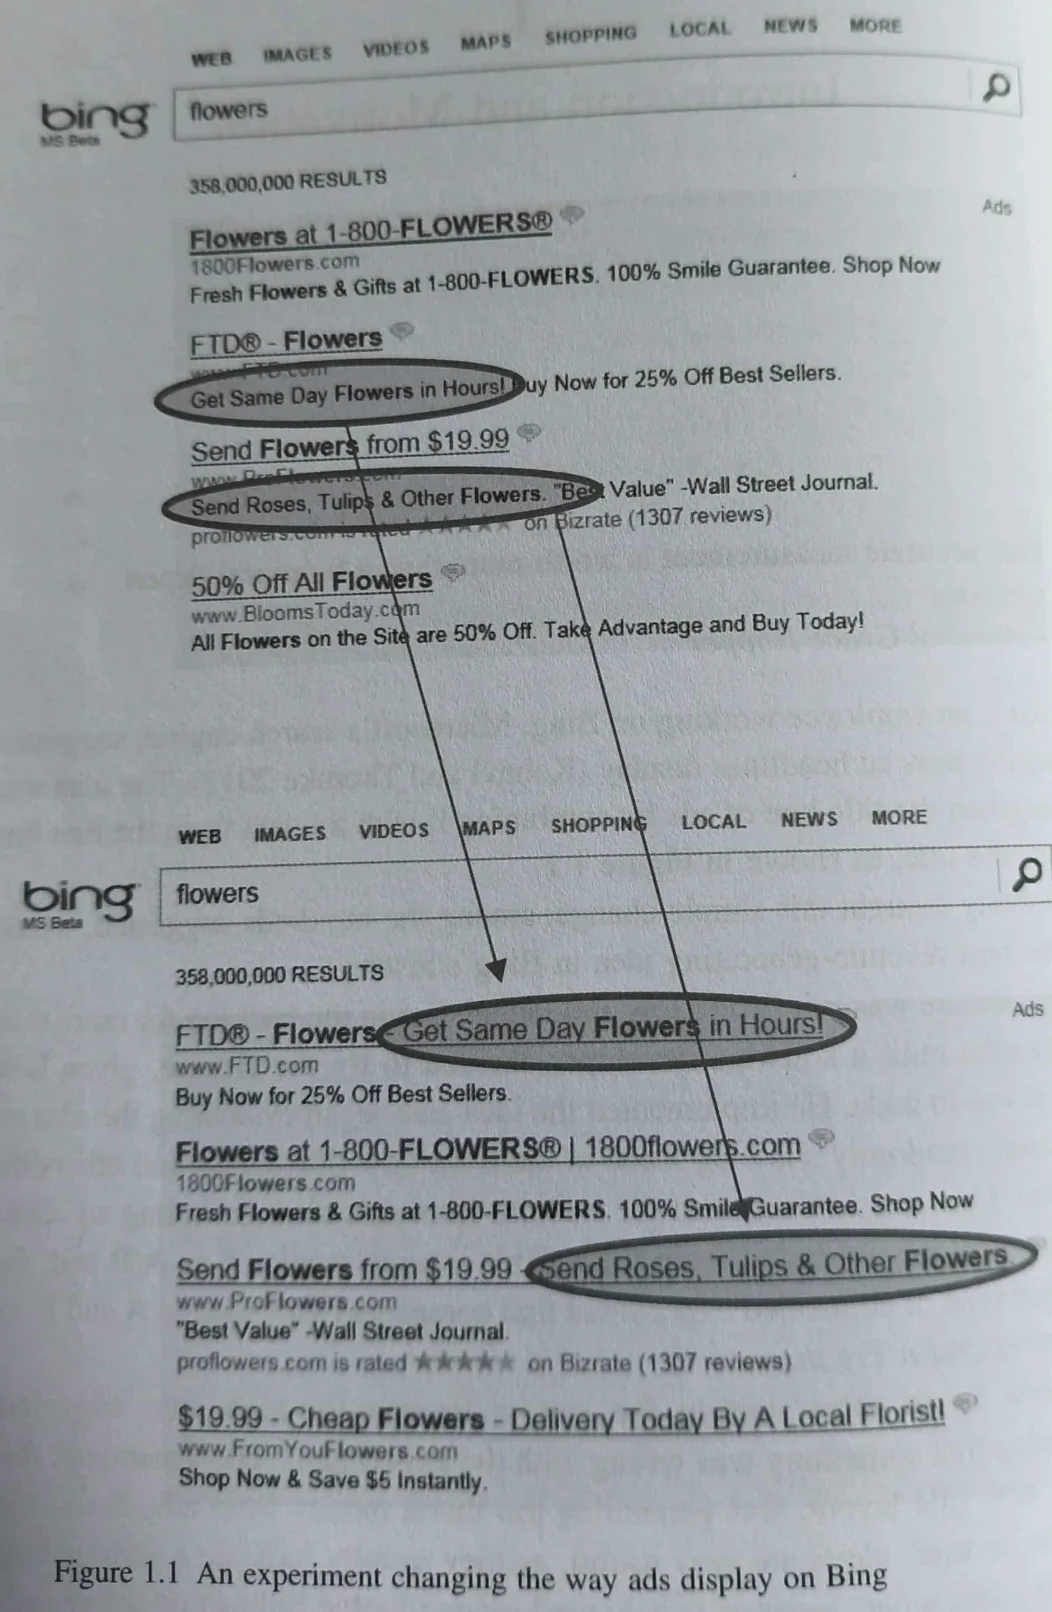
early 2012   an idea to change how ad titles
             displayed — one of hundreds
             stack-ranked below other work,
             so it sat for months

later        an engineer built it in days
             and ran it

             a revenue alert fired —
             Bing was making TOO MUCH money
             ↑ the detail that makes the story

result       +12% revenue
             ~$100 million/year
             Bing's best revenue idea ever
Why it gets told. Three separate arguments come out of one story, which is what makes it efficient — but each needs drawing out, because the story doesn’t state them.
1. Human prioritisation is unreliable. The idea was ranked below hundreds of others by experienced people exercising judgement, and it turned out to be worth more than all of them. The lesson isn’t that the rankers were incompetent — it’s that nobody can rank ideas by expected value before testing them, because the information needed to rank is exactly what the test produces. That’s the argument for cheap, high-volume testing over careful selection — Test Prioritisation.
2. Effect size doesn’t track effort or ambition. A cosmetic change to how ad titles rendered, built in days, beat every strategic initiative in the company. Meanwhile large redesigns routinely produce nothing. There is no reliable relationship between how significant a change feels and how much it moves — which is why pre-test effect estimates are closer to guesswork than anyone admits — Minimum Detectable Effect.
3. Trustworthiness machinery is what lets you believe a good result. The revenue alert existed to catch bugs. It fired, and the team’s first assumption was that the experiment was broken — Twyman’s law behaving exactly as advertised. They only accepted +12% after checking it wasn’t an error.
That third beat is the one most retellings drop, and it carries the book’s whole thesis. Without the checking apparatus, a 12% revenue result is indistinguishable from a bug, so it either gets dismissed or gets shipped on faith. An organisation that cannot verify its own wins cannot act on them.
The speed experiments — that page performance measurably moves revenue at large scale — are the other frequently-cited set. [CHECK: the specific millisecond-to-revenue figures before quoting any; several circulating versions conflate different companies and years.] The durable point is the direction, not the number — Performance and Conversion.
The numbers people quote
Verified, and worth having exactly right because they’re used to set expectations:
ACROSS MICROSOFT
  ~1/3 of ideas positive and significant
  ~1/3 flat
  ~1/3 negative and significant

AT BING SPECIFICALLY
  ~15% of launched experiments succeeded

BING RELEVANCE TEAM
  0.1–0.2% improvement per iteration
  ~2% accumulated annually
The “one third” figure is the one to know. It’s the standard counter to “our idea will obviously work”, and it reframes a programme’s purpose from validating ideas to killing them cheaply — Inconclusive Results, Win Rate and Expected Value.
The Bing relevance number is the underrated one: a serious programme’s wins are tiny and compound. That’s a more useful expectation-setter than any case study.
How it’s built
Five parts, and knowing which is which is the difference between finding it useful and finding it impenetrable:
1  Introductory topics for everyone
2  Selected topics for everyone
3  Complementary and alternative techniques
4  Advanced — BUILDING A PLATFORM
5  Advanced — ANALYSING EXPERIMENTS
Parts 1 and 2 are the practitioner book. Part 4 is for people building an experimentation platform, which almost no reader is. Part 5 is statistically dense.
Part 3 is the underrated one and the most relevant to a CRO role at ordinary scale. It covers what to do when a controlled experiment isn’t available — observational and quasi-experimental methods, interrupted time series, instrumented variables, difference-in-differences — plus user research as a complement rather than a rival. Most commercial work runs into “we can’t randomise this” constantly, and this is the part that addresses it — Difference-in-Differences, Incrementality Testing, Geo Holdout Tests.
The honest verdict
Reception is genuinely mixed, which is worth knowing rather than deferring to the reputation — the reputation is for its contribution to the field, and that’s a separate claim from it being a good read.
One reviewer’s summary is the fairest short version: “indispensable, but some assembly required.”
The recurring criticisms:
- It reads as expanded bullet points rather than as a written argument — closer to a busy academic’s class notes, with much of the detail deferred to the papers it cites
- Examples arrive without setup. They’re numerous, and their significance often goes unexplained, so the reader is left working out why each one is in the book
- Heavy self-citation. Reasonable, given the authors built the platforms in question — but it means the evidence base is narrower than the citation count suggests
- Three platform-builders writing for platform-builders, even in the parts labelled “for everyone”. The implicit reader has thousands of experiments a year and a dedicated data science team
- Uneven in difficulty, moving between “what is an A/B test” and variance-reduction methods without signalling the change
- Nothing is worked end to end. Concepts arrive in the authors’ order rather than the order the work happens
It also draws substantial praise, with plenty of readers finding it accessible and practical. The split appears to track what the reader came for.
What it’s genuinely good for: the vocabulary, the trustworthiness checklist, the numbers, and Chapter 3 on Twyman’s law. Excellent as a reference to look things up in; frustrating as a book to read through — which is roughly the opposite of how it presents itself.
Where this vault does it better
Not a boast — a filing note. The concepts are covered here in the order the work happens, so this note deliberately doesn’t repeat them:
- Overall Evaluation Criterion · Guardrail Metrics · Sample Ratio Mismatch
- Reading a Test Result · Inconclusive Results · Winner’s Curse
- Holdout Groups · Experiment Archive · Post-Test Validation
- Guide - Statistics for CRO — the assembled version
The one-paragraph take
“It’s the standard reference, and it’s where most of the vocabulary comes from — OEC, SRM, guardrails, Twyman’s law. The framing I took from it is that the hard part is trustworthiness rather than statistics: most results are wrong for mechanical reasons before they’re wrong for statistical ones. The one-third-positive figure is the useful one for setting expectations. It’s written by platform-builders for platform-builders though, so it’s better as a reference than a read.”