ICE, PIE, RICE prioritisation
Three closely related scoring frameworks for prioritising a hypothesis backlog:
- ICE - Impact × Confidence × Ease. Three 1-10 scores multiplied.
- PIE - Potential × Importance × Ease. Same shape, slightly different framing.
- RICE - Reach × Impact × Confidence × Effort. Four components, divides instead of multiplies on Effort.
All three exist to do the same job: turn a backlog into a ranked queue, force the team to make comparative judgements, and document why one test ran before another.
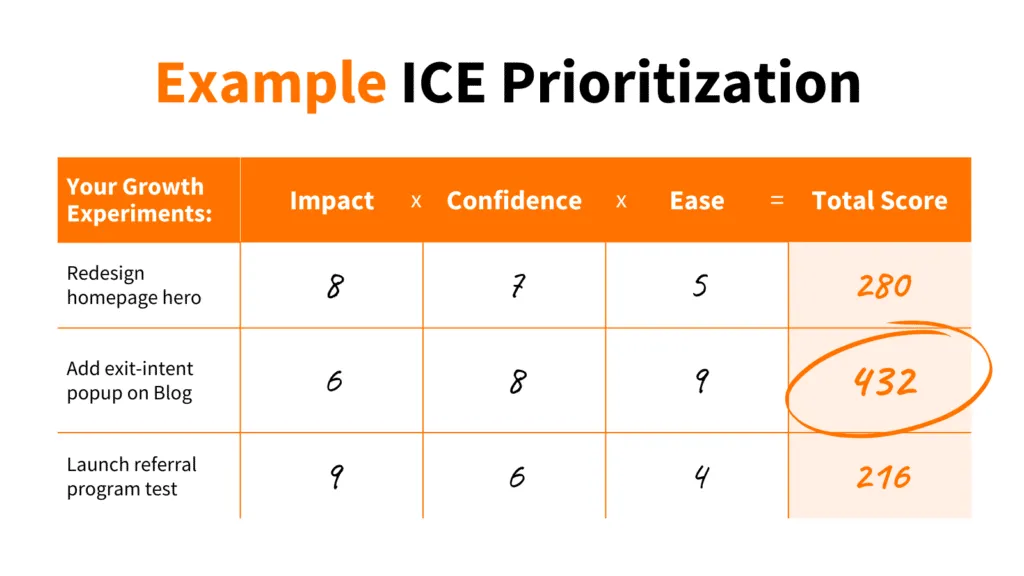
The simplest. Score each hypothesis from 1-10 on:
- Impact - if this works, how much would it move the metric?
- Confidence - how sure are you that it will work?
- Ease - how much engineering / design / research effort?
Multiply for the score. Sean Ellis popularised this for growth-team prioritisation, where speed of decisions matters more than precision of scoring.
Used by ConversionXL. Same three-factor shape with different labels:
- Potential - how much room for improvement on this page or flow?
- Importance - how much traffic / revenue flows through this surface?
- Ease - implementation cost.
Functionally identical to ICE for most purposes. The distinction matters mainly in how the team frames the conversation.
Used by Intercom’s product team. Adds Reach as a separate factor:
- Reach - how many users will the change affect (per month, quarter, etc.)?
- Impact - average effect per affected user.
- Confidence - probability the impact estimate is right.
- Effort - person-months to ship.
Score = (Reach × Impact × Confidence) / Effort.
Distinguishing Reach from Impact is the key addition. A 20% improvement that affects 100 users a month is a lower priority than a 2% improvement that affects 100,000 users a month, even though Impact-per-user is much higher in the first.
Where the frameworks help
Section titled “Where the frameworks help”The honest value of any of these isn’t the score. It’s the comparison. Forcing a team to score 30 hypotheses on the same axes surfaces disagreements about what matters and gives the leader something objective-looking to point at when prioritising.
The score itself is just three or four people’s guesses multiplied together. Treat the ranking as directional, not absolute. The hypothesis ranked #1 and #5 aren’t meaningfully different - either could be the right next test. The difference between #1 and #15 is.
Where they fail
Section titled “Where they fail”- Garbage in, garbage out. If the team scores everything 7 because they don’t want to commit, the framework produces noise.
- The Confidence factor gets gamed. Pet projects get rated high-confidence even when they shouldn’t. Build a culture of being honest about confidence, or the framework’s outputs reflect politics.
- Effort estimates are systematically too low. Software estimation is hard. Multiply effort by 2x and the rankings often invert.
- Score doesn’t capture strategic value. Sometimes you run a test because it’s politically important or because it teaches you about a new surface, not because it scores well. Frameworks don’t capture this.
- Treating the score as decision-final. The score should inform the conversation, not replace it.
When to switch between them
Section titled “When to switch between them”- ICE for early-stage teams that need a low-friction way to compare hypotheses.
- PIE if your team frames things in terms of page importance and potential rather than impact.
- RICE for product / SaaS where reach varies dramatically across surfaces and you want to factor it in explicitly.
For most Shopify CRO teams, ICE is enough. The Reach factor in RICE matters more when you have wildly varying audience sizes across surfaces.