P-values
The most misunderstood number in statistics, and probably the one you’ll be asked about most. A p-value is the probability of seeing data at least as extreme as what you observed, assuming the null hypothesis is true. That’s the whole definition. Everything else is wrong.
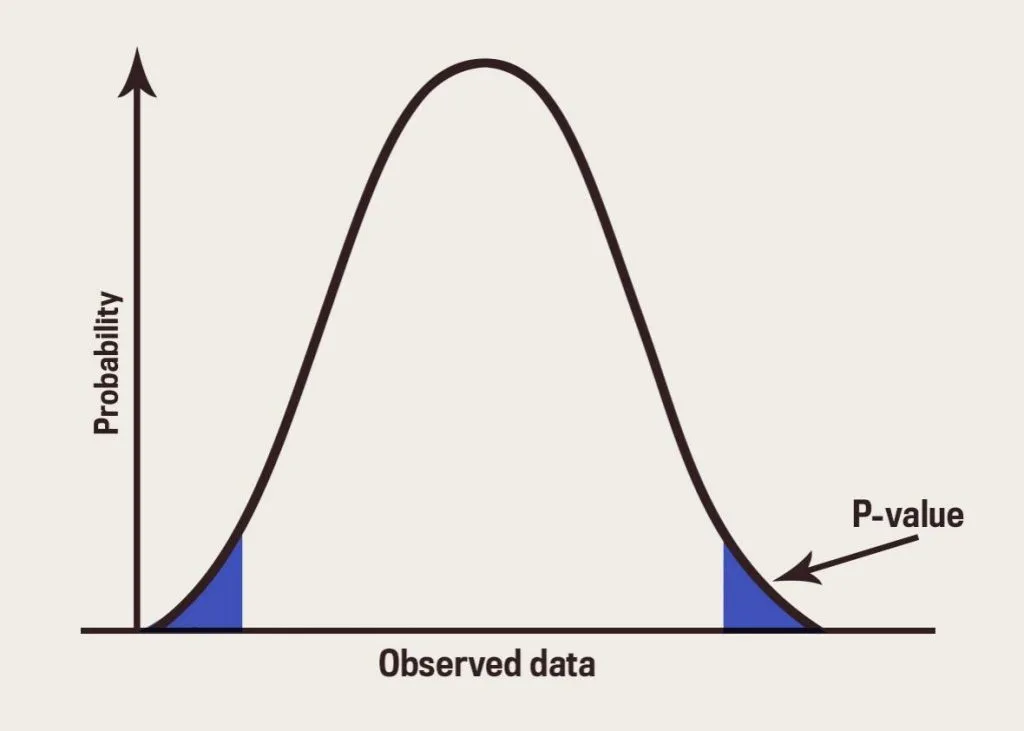
What it is not:
- The probability that the null hypothesis is true
- The probability that your result is due to chance
- The probability that the variant is better than control
- 1 minus the probability the variant works
These all sound like reasonable rephrasings but they’re not the same thing, and the difference matters a lot when you’re explaining a test result to a non-stats stakeholder. The p-value lives inside a conditional. It’s asking “if there were really no effect, how surprising would my data be?”. It doesn’t say anything directly about whether there is an effect.
A worked example. You run a test on a new PDP layout. Conversion is 3.5% on control, 3.9% on variant. The tool spits out p = 0.03. Correct interpretation: if the new layout actually had zero effect on conversion, you’d see a difference this big (or bigger) in only 3% of repeat experiments. That’s enough surprise to reject the null at the standard 5% threshold. It does not mean “there’s a 97% chance the variant is better”.
The Bayesian framework actually does give you “probability the variant is better than control” directly. That’s a big part of why Bayesian tools have become popular in CRO - the output maps to the question people actually want to ask.
The size of p doesn’t tell you the size of the effect. A p-value of 0.001 means strong evidence against the null. It doesn’t mean the effect is bigger than at p = 0.04. With enough sample size, even trivial effects (0.05% lift) will return tiny p-values. Always look at the effect size and confidence interval alongside, not just whether p crossed 0.05.
Two habits follow from all this. Stop reading p as a binary - it’s a threshold, not a truth function, and p = 0.049 and p = 0.051 are the same amount of evidence with very different amounts of celebration attached. And don’t go hunting for one: running variants, metrics or segments until something crosses 0.05 and reporting that one is p-hacking, and across 20 comparisons at alpha 0.05 you’d expect a false positive by chance alone.