Simpson's paradox
A trend that appears in subgroups can reverse or vanish when you combine the groups. Variant A beats B on desktop. Variant A also beats B on mobile. Combine them and B wins overall. The maths doesn’t break, what’s happening is that the groups have different traffic mixes and different baseline rates, and those imbalances dominate the comparison once you stop holding them constant.
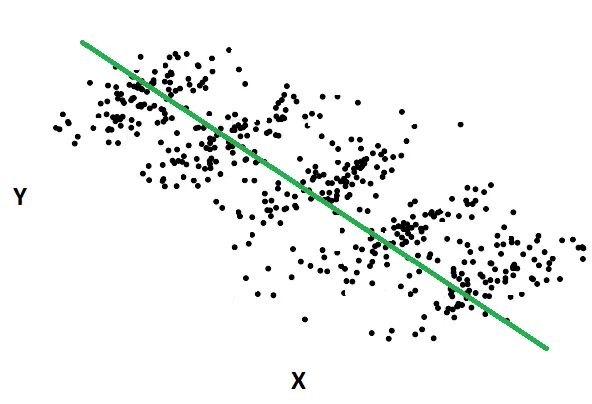
The classic real-world example is UC Berkeley graduate admissions in 1973. Looking at the whole university, men were admitted at a higher rate than women, which looked like clear bias. Department by department, women were admitted at the same rate or higher in almost every department. The aggregate bias appeared because women applied disproportionately to the harder-to-get-into departments. Same data, two contradictory conclusions depending on whether you cut by department.
In CRO it shows up two ways:
- Aggregate hides a segment effect. Variant A is significantly better overall but only because it helps desktop traffic (60% of your visitors) while hurting mobile (40%). The overall number averages it out and you’d ship something that’s actively bad for half your users.
- Aggregate contradicts the segment effect. Variant A wins in every segment but loses overall, usually because the variants attracted slightly different traffic mixes during the test. Often a sign of a sample ratio mismatch or a randomisation problem.
What to do about it
Section titled “What to do about it”Always look at the major segments alongside the aggregate. Not so many segments that you trip the multiple testing problem, but the obvious cuts: mobile vs desktop, new vs returning, paid vs organic. If the segments tell a consistent story and the aggregate agrees, ship. If they disagree, work out why before shipping anything.
The cases where Simpson’s paradox bites hardest in CRO are when traffic composition shifts mid-test. A seasonal change, a paid campaign turning on or off, an SEO update. The split is no longer apples-to-apples and the aggregate result reflects the composition change, not the variant effect.
The framing that makes this useful rather than merely curious: it isn’t a weird statistical quirk, it’s a symptom of confounding. When the subgroups and the aggregate disagree, something is correlated with both segment membership and the outcome, and that something is worth finding. Treat the disagreement as a flag rather than a footnote - and don’t resolve it by picking whichever level of aggregation gives you the answer you wanted.